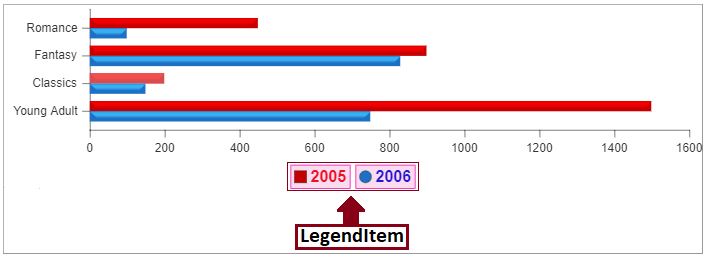
LegendItem
An entry/item displayed inside Legend element of the Chart
Class: Chart.LegendItem()
LegendItem represent a DataSeries/DataPoint inside Legend.
Code using Axis Class
                                    var chart = new Cosfire.Chart("chart-container",{width:700,
                                                 height:250});

 /* Create instance of LegendItem */
 data: [{
         plotAs: 'bar',
         name: '2005',
         legendItem: {
         borderWidth:1.5,
         borderColor:'#f707a7',
         background:'#fadcf0',
         marker: {type:'square'},
         font: {fontSize:16,
                fontColor:'#ed0e21',
                fontWeight:'bolder'},
        },
         points: [
                 {xLabel: "Young Adult", y: 1500},
                 {xLabel: "Classics", y: 200},
                 {xLabel: "Fantasy", y: 900},
                 {xLabel: "Romance", y: 450}
                 ]
        },
        {plotAs: 'bar',
         name: '2006',
         legendItem: {
         borderWidth:1.5,
         borderColor:'#f707a7',
         background:'#fadcf0',
         font: {fontSize:16,
                fontColor:'#2714d9',
                fontWeight:'bolder'}
        },
         points: [
                 {xLabel: "Young Adult", y: 750},
                 {xLabel: "Classics", y: 150},
                 {xLabel: "Fantasy", y: 830},
                 {xLabel: "Romance", y: 100}
                 ]
        }
  ];

 /* Add the legendItem to dataSeries and dataPoint */
 chart.setData(data);
 chart.render(); // draw the chart
Using JSON Approach
                                     var chartJSON = {
     width: 500,
     height: 300,
     data: [{plotAs: 'bar',
             name: '2005',
             legendItem: {
             borderWidth:1.5,
             borderColor:'#f707a7',
             background:'#fadcf0',
             marker: {type:'square'},
             font: {fontSize:16,
                    fontColor:'#ed0e21',
                    fontWeight:'bolder'},
            },
             points: [{ xLabel: "Young Adult", y: 1500 },
                     { xLabel: "Classics", y: 200 },
                     { xLabel: "Fantasy", y: 900 },
                     { xLabel: "Romance", y: 450 }]
            },
            {plotAs: 'bar',
             name: '2006',
             legendItem: {
             borderWidth:1.5,
             borderColor:'#f707a7',
             background:'#fadcf0',
             font: {fontSize:16,
                    fontColor:'#2714d9',
                    fontWeight:'bolder'}
            },
             points: [{ xLabel: "Young Adult", y: 750 },
                     { xLabel: "Classics", y: 150 },
                     { xLabel: "Fantasy", y: 830 },
                     { xLabel: "Romance", y: 100 }]
             }]
  };

 var chart = new Cosfire.Chart("chart-div", chartJSON);
 chart.render();
List of Properties Supported in LegendItem.
| Styling The LegendItem | ||||
| Property | Type | Default | Possible Values | Description |
|---|---|---|---|---|
| borderWidth | Number |
Not set | --- | Border width or line thickness of the legendItem represents a DataSeries/DataPoint. If not set chart generates auto value to make the chart look beautiful. |
| borderColor | String |
Not set | Colors are specified using predefined color names, or RGB, HEX, HSL, RGBA, HSLA values. | Border color of the legendItem represents a DataSeries/DataPoint. If not set chart generates color for the data point automatically to make the chart look beautiful. |
| marker | marker |
Not set | --- | This property is of type Marker allows to apply style on the marker on screen that represents a DataPoint. |
| Background And Font Style Properties | ||||
| Property | Type | Default | Possible Values | Description |
|---|---|---|---|---|
| background | String |
Not set | Colors are specified using predefined color names, or RGB, HEX, HSL, RGBA, HSLA values. | Background color of legend Item. |
| font | Font |
Not set | --- | LegendItem text font style. This property is a object of type Font provides all the necessary functionality for styling the font. |